Running an Application on a Remote GPU
When your system is connected to a remote machine, any application whose path is listed in the Paths tab will automatically run on the remote GPU, leveraging its processing power instead of your local GPU.
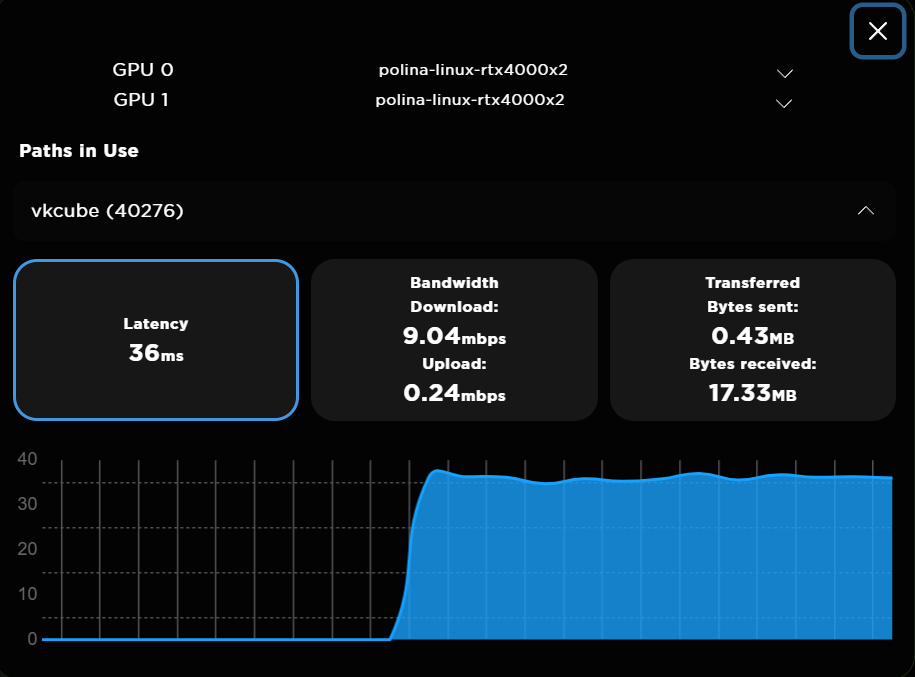
You can monitor the performance of these applications in real-time to understand how they are utilizing the remote connection.
Viewing Application Performance
To see how a specific application is performing with the remote GPU:
-
While connected, ensure the application you want to monitor is running.
-
From the Connect GPU tab, scroll down to the Paths in Use section.
-
Click on the desired application to expand its details.
-
Once expanded, you will see a dashboard with real-time metrics for the selected application.
Understanding the Metrics
This dashboard provides key insights into the connection's performance for that specific application.
Latency
Latency is the time it takes for data to travel from your computer to the remote GPU and back. It is measured in milliseconds (ms). Lower latency results in a more responsive, "native" feel. The graph at the bottom displays the latency over the last several seconds.
Bandwidth
Bandwidth measures the rate of data transfer over the network connection, shown in megabits per second (mbps).
Download: The rate at which data (like rendered frames) is sent from the remote GPU back to your display.
Upload: The rate at which data (like user inputs or commands) is sent from your computer to the remote GPU.
Transferred
Transferred shows the total amount of data that has been moved between your system and the remote GPU during the current session, measured in megabytes (MB).
Bytes sent: The total data uploaded to the remote GPU.
Bytes received: The total data downloaded from the remote GPU.
Help Improve This Page
Found a mistake? Want to contribute? Edit this page on GitHub or explore more editing options.